The Deception of “Stable”: What Traditional Vital Sign Checks Miss on a Busy Shift
Step into any care home at 2:00 PM, and you'll see a familiar routine. A quick spot-check shows perfectly normal vitals. On paper, the resident is “stable.” But in social care, stable can be a dangerous illusion.
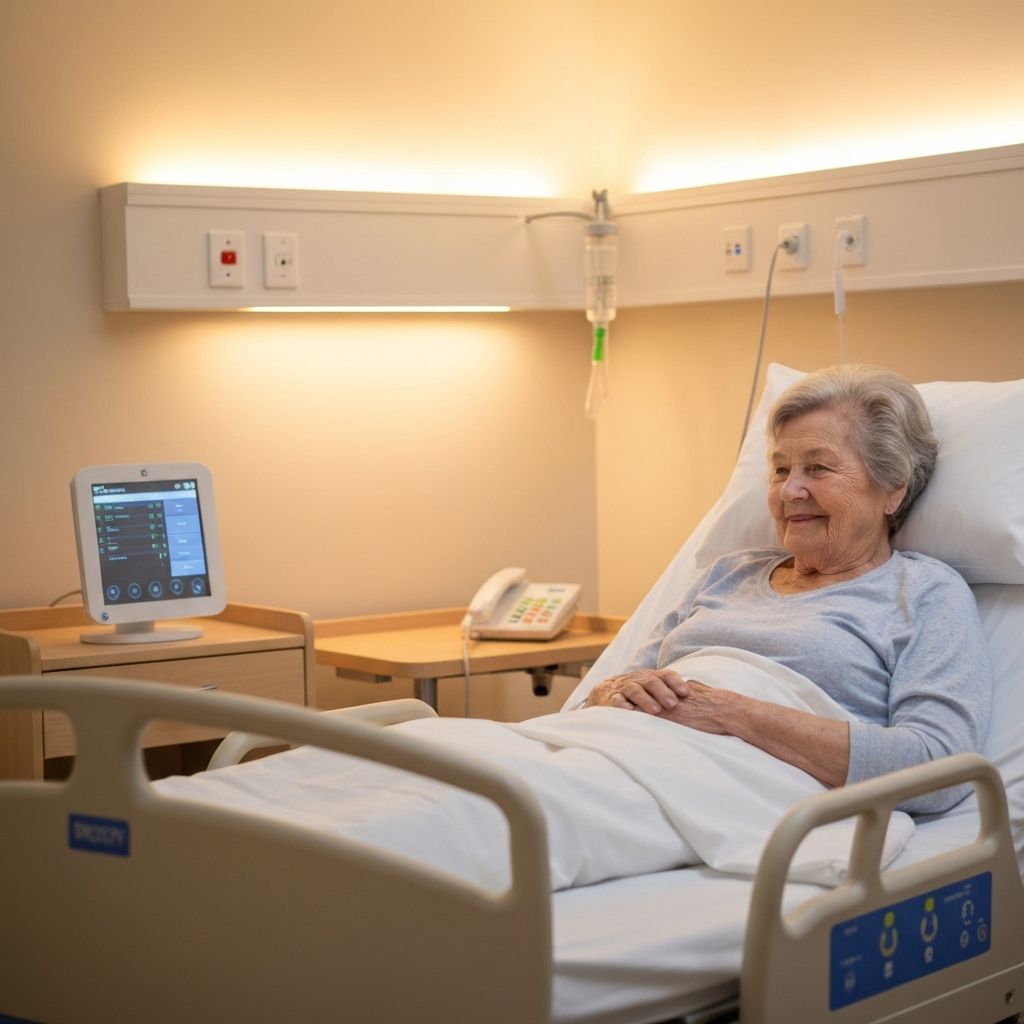
The biggest gap in modern care isn't a lack of effort—it's a lack of continuous visibility. Traditional care software captures a single moment in time—a snapshot. But health doesn't happen in snapshots; it happens in trends.
When we rely purely on periodic checks, we miss the hidden warning signals that occur in the hours between rounds. To prove this, let's look at a real 24-hour window of continuous telemetry data captured during our recent pilot.
A Tale of Two Realities: One Day, Two Completely Different Stories
Below is anonymized tracking data of a single resident over a 24-hour period. It reveals a dramatic hidden narrative that a standard, intermittent spot-check would have completely missed.
The Standard Snapshot (What the Care Log Sees)
If a senior carer checked this resident during standard daytime intervals, here is what they would record:
To any manager or auditing body, this resident had a perfectly healthy day.
The Continuous Reality (What PenielSense Actually Caught)
Because our platform tracks baselines passively throughout the entire day and night, the system flagged 15 total telemetry exceptions that never made it into the manual care logs.
| Time | Metric Tracked | The Signal | The Real-World Risk |
|---|---|---|---|
| 01:00 AM | Oxygen Saturation (SpO₂) | Dropped to 90% | Critical nocturnal desaturation. Early sign of respiratory distress or sleep apnea. |
| 05:30 AM | Heart Rate & SpO₂ | 49 bpm / 91% SpO₂ | A sustained 30-minute physiological dip during deep sleep cycles. |
| 12:30 PM | Heart Rate | Dropped to 49 bpm | Daytime bradycardia event occurring while awake. |
| 10:30 PM | Heart Rate | Plummeted to 46 bpm | Deep cardiac suppression right after settling into bed. |
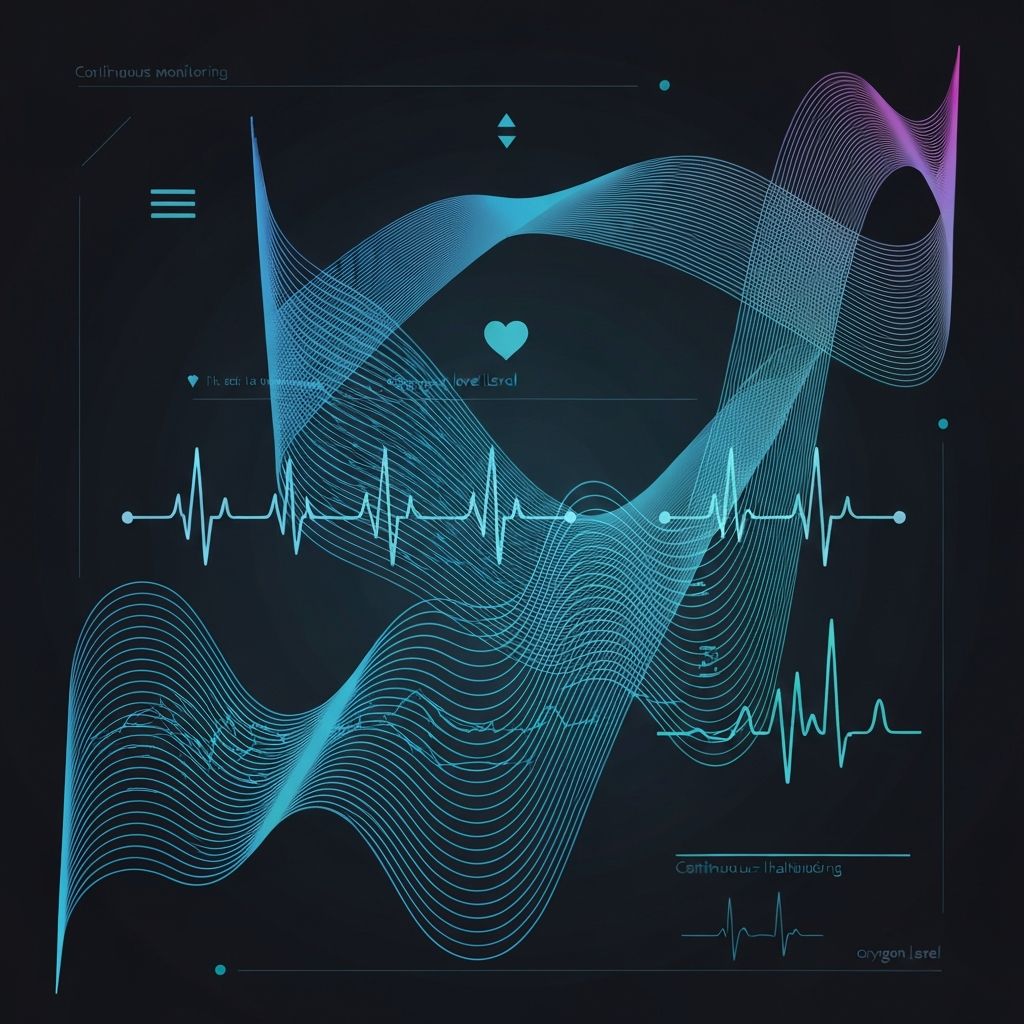
Continuous Telemetry vs Intermittent Spot-Checks
[Continuous Telemetry vs Intermittent Spot-Checks]
|
|   100% --------- Normal Baseline ---------
|                 \          /
|  Spot Check      \        /      Spot Check
|   [Normal]        \      /        [Normal]
|                    \    /
|                     \  /
|                      \/
|                 Hidden Drop (90% SpO₂)
|___________________________________________
   08:00              01:00              08:00
24-Hour Heart Rate & SpO₂ Monitoring
* Red dashed lines indicate critical thresholds (HR < 50 bpm, SpO₂ < 92%)
Why These “Invisible” Deviations Matter
When a resident ends up in hospital with a severe illness like a UTI or respiratory failure, it often feels like an unpredictable emergency. But medical literature and raw data tell us a different story: the body almost always flags the crisis hours, or even days, before it happens.
In the case study above, the recurring combination of depressed night-time heart rates (under 50 bpm) and significant oxygen drops (down to 90%)are classic early warning signs. Left unmonitored, these patterns quietly erode a resident's physiological reserve.
By the time they show physical symptoms like confusion, lethargy, or a screaming fever, the condition has already escalated into an emergency. Traditional telecare is reactive—it waits for a fall or a button press. Clinical platforms are often too complex for an already stretched care team to manage.

Bridging the Gap
At PenielSense, we believe care teams deserve better than guessing what happens between rounds. Our platform doesn't try to make complicated clinical diagnoses or swamp staff with complex data. Instead, it continuously maps each resident's personal health baseline and flags when those boundaries start to drift.
By catching subtle fluctuations early, we give frontline staff the one thing they need most to prevent a crisis: time.
We're shifting social care away from reactive crisis management and turning it into proactive, life-saving prevention. Because protecting vulnerable residents means seeing the whole story—not just the snapshots.
Ready to See Beyond the Snapshots?
Learn how PenielSense can help your care home catch health issues before they become emergencies.